Note: Building Approvals, Australia, November 2006 was reissued 16th January 2007 to correct Queensland seasonally adjusted and trend estimates for value of buildings approved in publication tables 15, 16 and value of non residential building approved in publication table 18. No other data in the publication were affected.
The related electronic spreadsheet tables 32, 39 and 41 have also been corrected for these errors, and to restore historical data prior to July 2000 that were inadvertently suppressed in the original release. Spreadsheets 30, 31, 32, 33, 34, 38, 39 and 41 relating to value of buildings approved have been corrected to restore historical data prior to July 1973 that were also inadvertently suppressed in the original release.
NOVEMBER KEY FIGURES
 |  | Nov 06 | Oct 06 to Nov 06 | Nov 05 to Nov 06 |
 |  | no. | % change | % change |
|
| TREND |  |  |  |
 | Total dwelling units approved | 12 627 | -1.2 | 2.2 |
 | Private sector houses | 8 919 | -0.1 | 5.4 |
 | Private sector other dwellings | 3 351 | -5.0 | -6.4 |
| SEASONALLY ADJUSTED |  |  |  |
 | Total dwelling units approved | 12 739 | 4.1 | -0.4 |
 | Private sector houses | 8 881 | 3.1 | 3.4 |
 | Private sector other dwellings | 3 421 | 2.4 | -12.0 |
|
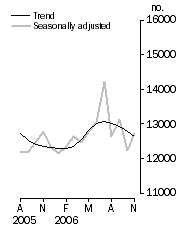
Dwelling units approved, Total number

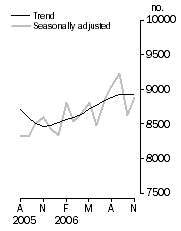
| Private sector houses approved, Total number

|
NOVEMBER KEY POINTS
TOTAL DWELLING UNITS
- The trend estimate for total dwelling approvals fell 1.2% in November 2006.
- The seasonally adjusted estimate for total dwelling units approved rose 4.1%, to 12,739, in November 2006. Increases in public sector other dwellings were a significant contributing factor to the increase in total dwellings this month.
PRIVATE SECTOR HOUSES
- The trend estimate for private sector house approvals fell 0.1% in November 2006.
- The seasonally adjusted estimate for private sector houses approved rose 3.1%, to 8,881, in November 2006.
PRIVATE SECTOR OTHER DWELLING UNITS
- The trend estimate for private sector other dwellings approved fell 5.0% in November 2006.
- The seasonally adjusted estimate for private sector other dwellings approved rose 2.4%, to 3,421, in November 2006.
VALUE OF BUILDING APPROVED
- The trend estimate for the value of total building approved fell 0.6% in November 2006. The value of new residential building fell 0.2% and the value of alterations and additions rose 1.0%. The trend for the value of non-residential building approved fell 1.5% in November 2006.
- The seasonally adjusted estimate for the value of total building approved rose 1.4%, to $5,336.4m, in November 2006. The value of new residential building approved rose 3.3%, to $2,750.1m. The value of alterations and additions rose 2.2%, to $490.9m. The value of non-residential building fell 1.2%, to $2,095.5m.
NOTES
CHANGES IN THIS ISSUE
There are no changes in this issue
REVISIONS THIS MONTH
Revisions to Total Dwellings in this issue are:
 | 2005-06 | 2006-07 | Total |
|
| NSW | 9 | - | 9 |
| Vic. | - | -5 | -5 |
| Qld | - | 16 | 16 |
| SA | 33 | -1 | 32 |
| WA | 4 | 155 | 159 |
| Tas. | - | -1 | -1 |
| NT | - | - | - |
| ACT | - | - | - |
| Total | 46 | 164 | 210 |
|
One missing permit added to August 2006 data contributed to an upward revision of $69.7 million value and 135 dwelling units to residential building approved in Western Australia.
A duplicate permit removed from July 2006 data contributed to a $61.7 million downward revision to the value of non-residential building approved in Queensland.
INQUIRIES
For further information about these and related statistics, contact the National Information and Referral Service on 1300 135 070 or Paul Pamment on Adelaide (08) 8237 7499.
 Print Page
 Print All